
THE solar panel installation a great way to reduce our electricity bill and become a more conscious consumer. But how do we know if the system installed on our roof is working best? This is where the inverter app comes into play. The applications for the inverter of the solar panel system help us monitor the performance of our solar panels, which gives us more than just looking at our own little power plant with satisfaction.
The application is an essential tool for all those who who installed a solar system – and it applies automatically to all installers. It provides invaluable information about production, real-time monitoring and historical data to facilitate troubleshooting and optimization.
I can see how the inverter works
With the detailed reports, we can see how the system works on our mobile and assess how changes in the weather or other factors affect it. Maintaining optimal performance is therefore really simple, monitoring the amount of energy produced and the efficiency of all elements of the system.
Different performance indicators can be checked in the inverter app, for example the current production performance, the daily peak performance and even the energy produced daily, monthly, yearly or since the system was put into operation. This information can be used to identify potential areas of improvement and take the necessary steps to optimize energy production.

Are you producing as much as you need?
When we prepare an offer, we always provide a production estimate so that the customer knows what to calculate. Of course, how much it can produce depends on the size of the solar panel system, the peak value is also smaller with a small system, but all this becomes reality in the application. When the system is live and the inverter app is active, the measured values can be compared with the preliminary estimate.
In addition to up-to-date data, it also provides historical data, so users can monitor their energy production over time. Daily curves can show different performance indicators, such as production peaks and total energy produced. This data can be used to create detailed reports that provide insight into the overall operation of the solar system. Moreover, we can compare our energy production with regional averages.
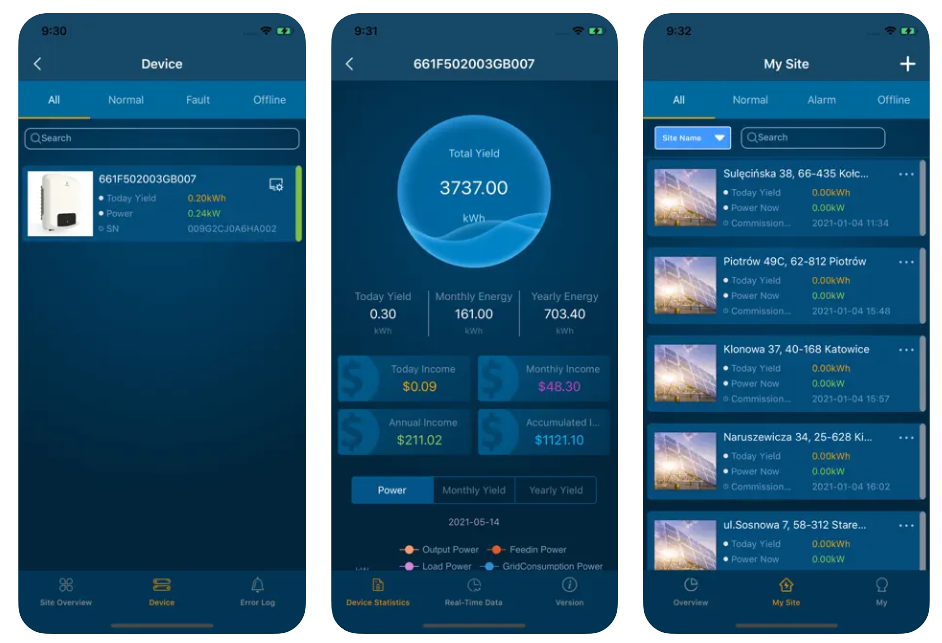
If the system also includes a smart meter, its measurements are displayed on a plus curve within the inverter app. In this way, even more information is available, since with the help of the tool you can track the current consumption of your property, how much is supplied by the solar panel and how much electricity we need to buy from the grid at the given moment.
Conscious routine adapted to the system
With the information provided by the application, we can easily adjust our daily energy consumption, so if we have the opportunity, we can adapt the operation of household appliances and the charging of the e-car to the production of their solar system.
By taking advantage of the app's real-time data tracking capabilities, we can take proactive measures to get the most out of our solar system and become a conscious energy consumer.